If you’re a business owner or a manager at any level in any organisation, you need employee engagement.
Apart from the obvious benefit of working with people who are fully engaged, by which we mean personally involved in the success of your organisation, there’s a clear and well-researched link between employee engagement, and customer loyalty, productivity, and profitability.
As a leader, you’ll know first hand that your best and most engaged people can drive innovation, increase performance and raise productivity. Engaged people grow your organisation, improve customer care, and foster loyalty, both internally and externally.
So where does your organisation stand? Do you have lots of really engaged staff?
Have you created or are you working in the kind of place you and your team want to work?
Is there a gap between the way you as a leader are experiencing the organisation compared to everyone else?
If you’re working in an organisation where people are engaged but you know there’s room for improvement, or you’re running a business that you love but the engagement levels of your team just aren’t where you want them to be – what can you do about it?
Where to Start with Employee Engagement
The first place to start is to get a handle on what the current levels of employee engagement are in your organisation, and a full understanding of where your team is at, right now.
So here’s a simple DIY Audit tool that can help:
The Culture Audit Toolkit
To get a quick and dirty snapshot of what your current levels of engagement are now, ask your people to fill in an anonymous survey.
We have two options:
- Our new, free easy-to-use online tool – How Engaged. Click here to use it.
- Do it yourself manually, using printed sheets and following the instructions below.

Manual Audit Instructions
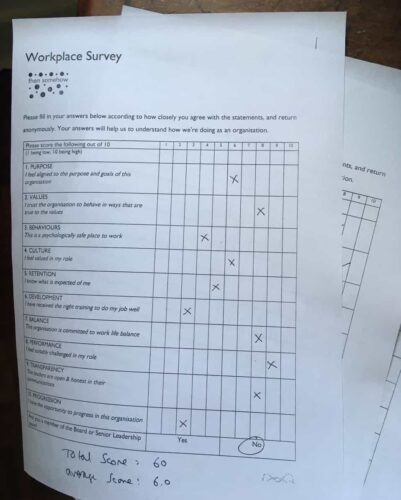
Step 1 – print off these worksheets, and hand them out (ie survey your workforce)
There are 10 key statements included in the survey, they’re all strong indicators of the levels of employee engagement in organisations. They’re listed below with the workplace themes they relate to. When you do the survey, ask people to mark their response on a scale of 1 to 10, 1 being low, 10 being high.
- I feel aligned to the purpose and goals of this organisation (PURPOSE)
- I trust the organisation to behave in ways that are true to our values (VALUES)
- This is a psychologically safe place to work (BEHAVIOURS)
- I feel valued in my role (CULTURE)
- I know what is expected of me (RETENTION)
- I have received the right training to do my job well (DEVELOPMENT)
- This organisation is committed to work life balance (BALANCE)
- I feel suitably challenged in my role (PERFORMANCE)
- The leaders are open and honest in their communications (TRANSPARENCY)
- I have the opportunity to progress in this organisation (PROGRESSION)
You can add an 11th question if you want to establish if there is a gap between leadership and the rest of the business, still keep it anonymous, simply ask:
Are you a member of the Board or Senior Leadership Team? Y/N
If you want to run this survey in your organisation, here’s a link to a FREE WORKSHEET YOU CAN DOWNLOAD.
Print it off, hand it around, get people to return it anonymously via a post box or similar mechanism in your office.
(Alternatively use our new, free easy-to-use online tool – How Engaged.)
Step 2 – Analyse the results
When you’ve got the results back, you can do the following simple calculations to give you some helpful indicators:
1. Work out a simple engagement metric for each person:
a. For each person, tot up their total score for each question / divide by the number of questions (ten). This gives you their personal employee engagement metric.
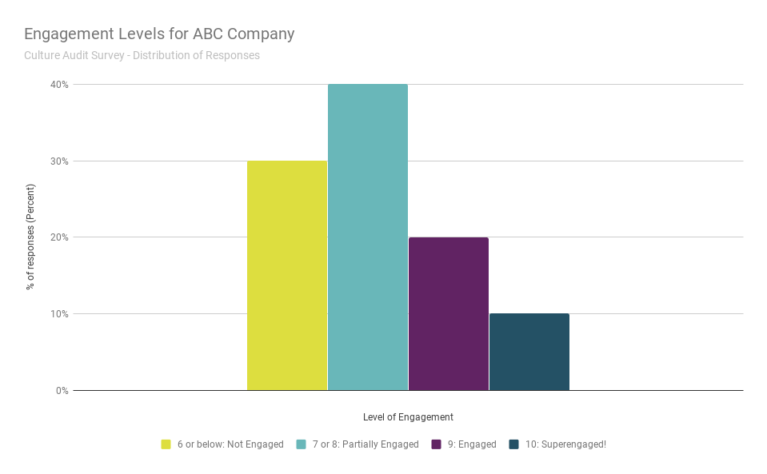
b. Group the metrics into bands, then make a simple bar chart to show the distribution across your organisation. You might want to use these classification bands:
Engagement Metric Classification Bands: How many people scored <6, 7, 8, 9 or 10?
| Average Score | Engagement Level |
|---|---|
| 6’s or below | suggests Not Engaged |
| 7’s or 8’s | are neither actively disengaged nor fully engaged, so indicates Partially Engaged |
| 9’s | people are Engaged |
| 10’s | are Super Engaged! |

The chart above shows that with a couple of notable exceptions, most people at ABC Company are Not Engaged or are Partially Engaged.
It’s a rough measure, but it’ll give you a clue to the number of people who are Not Engaged / Partially Engaged / Engaged / Super Engaged in your organisation.
How does it skew for you? What does it make you curious about.
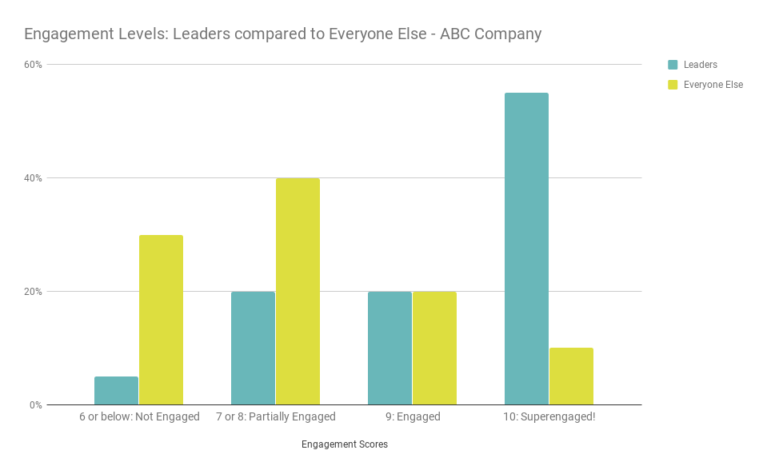
If you asked the extra question requesting people to identify as leaders you can make a comparison between the bosses and the rest of us. How big is the gap between those two groups? You can plot them on a similar chart:

The chart for ABC Company shows that their leaders are skewing differently – it’s worth paying attention to this as it might have implications for how they’re communicating or how they’re being received.
2. It’s also interesting to look at the strengths and weaknesses across each workplace theme.
To do this:
a. Collate the individual scores for each question (theme): add them all up and divide by the number of respondents to give you a mean score for each.
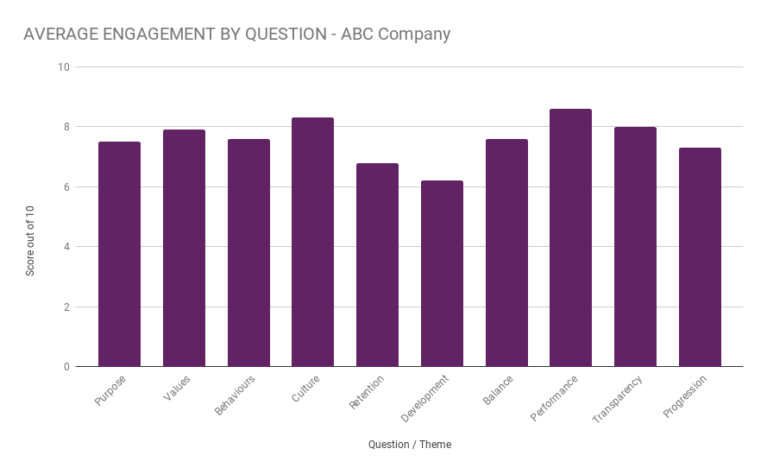
b. Plot those scores on another simple bar chart. Where do you score well or poorly? What does that suggest about where you could focus?

You can see that ABC Company appears to be fairly consistent across all themes, apart from Retention and Development (questions 5 and 6).
(If this all sounds a bit complicated, try How Engaged – did we mention it’s free and easy-to-use?)
Step 3 – So what’s all this telling you about employee engagement?
There are probably some surprises in the responses, along with some things that you could have predicted a mile off, there may be areas that you are really proud of, and others that could be puzzling you.
The thing is, the numbers only tell you half the story. In fact, they only tell you where you should start asking more questions.
Step 4 – Use the Once and Future Stories Tool
To understand more, you need to ask more questions and find out the stories behind the scores.
If you’re really interested in pursuing this, we recommend taking a look at Culture Catalyst, and the Once and Future Stories tool.
Culture Catalyst is a more comprehensive tool for measuring, benchmarking and revealing the culture in your organisation. Once and Future Stories is a tool that uses stories to move your organisation forward.
Once you have a view of what might be going on, what your perception of engagement levels is compared to the reality of how engaged or not people are, you can work out what to do next.
Whatever you find out, improving engagement can only be a positive thing for your organisation.
And we have tools for that too!
Til next time.
To help you find out more about what might be happening in your organisation, have a look at superengaged.co.uk by Nikki Gattenby of award-winning agency Propellernet. We’ve worked with them for many years helping them shape what was a ‘great’ place to work into one that’s an ‘amazing’ place to work. Nikki is brutally honest about what they were good at and what sucked, she’s really helpfully at suggesting things you can do about your culture.
She’s written a book about her experience – we worked together on the last chapter where you’ll find a version of these tools, plus we snuck in an extra one that helps you think about what ‘better’ should look like in your organisation, and shows you how to make a plan for how to get there. It’s really good – I recommend you buy the book and try it out.
UPDATE: Hear Nikki from Propellernet and Steve from Then Somehow speaking about the secret to a super engaged team at Meaning Conference, Nov 2018. Tickets and more details here.
